Page Banner

In-house graphic-Analyses-Q2-FY1617-TAT-Labs

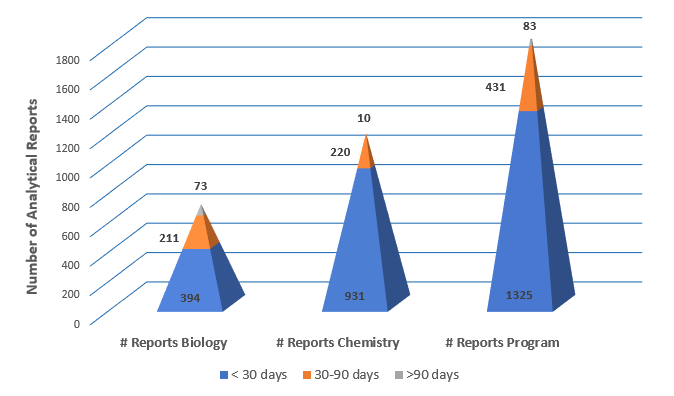
A chart showing the numbers of biological and chemical analysis reports issued between October 1 to December 31, 2016. The Laboratory Programs value (1,839) represents the sum of the biological (678) and chemical (1,161) reports. The reports are grouped according to the turnaround expectations of the laboratory's clients: less than 30 days, 30 to 90 days, and more than 90 days.
Numbers of biological and chemical analysis reports issued between October 1 to December 31, 2016.  The Laboratory Programs value (1,839) represents the sum of the biological (679) and chemical (1,161) reports. The reports are grouped according to the tu
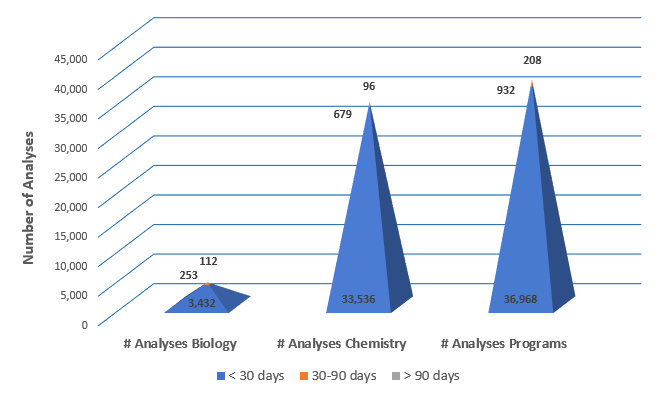
Numbers of biological and chemical analyses completed between October 1 to December 31, 2016.  The Laboratory Programs value (38,108) represents the sum of the biological (3,797) and chemical (34,311) analyses.  The analyses are grouped according to the t

Some content on this site is saved in an alternative format. The following icons link to free Reader/Viewer software:
PDF: | Word: | Excel: