Geophysics is the subsurface site characterization of the geology, geological structure, groundwater, contamination, and human artifacts beneath the Earth's surface, based on the lateral and vertical mapping of physical property variations that are remotely sensed using non-invasive technologies (EEGS, 2022). Near-surface geophysics employ noninvasive methods for collecting data about the shallow (tens of meters) subsurface. The Florida Geological Survey currently has 4 different near-surface geophysics systems that allow for efficient investigation for a variety of field sites.
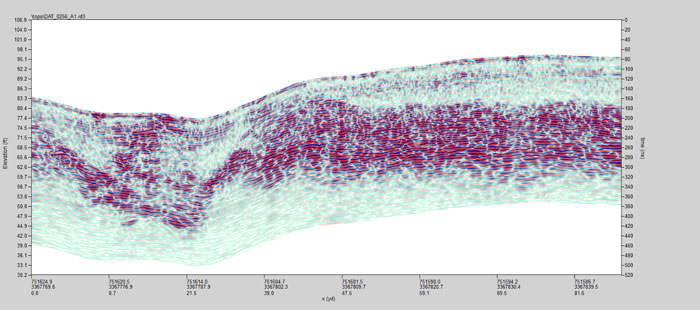
GPR uses electromagnetic pulses (radar) that are transmitted into the earth by an antenna and reflected off objects and surfaces that return to the surface and are collected by the receiving antenna. These received radar pulses are used to construct an image of the subsurface (Figure 1). GPR is commonly used to identify anomalies that may be associated with karst activity (sinkholes, conduits, etc.), map top of bedrock, detect the water table, map shallow lake bathymetry and stratigraphy, identify potential unmarked graves, and map the freshwater/saltwater interface.
GPR limitations- saltwater and metals have very high conductivity, causes ringing in signal trace (noise). Clays and freshwater attenuate, or diminish, the radar signal.
Figure 1. Example of a GPR radargram. Depression on the left side of the image is a karst depression.
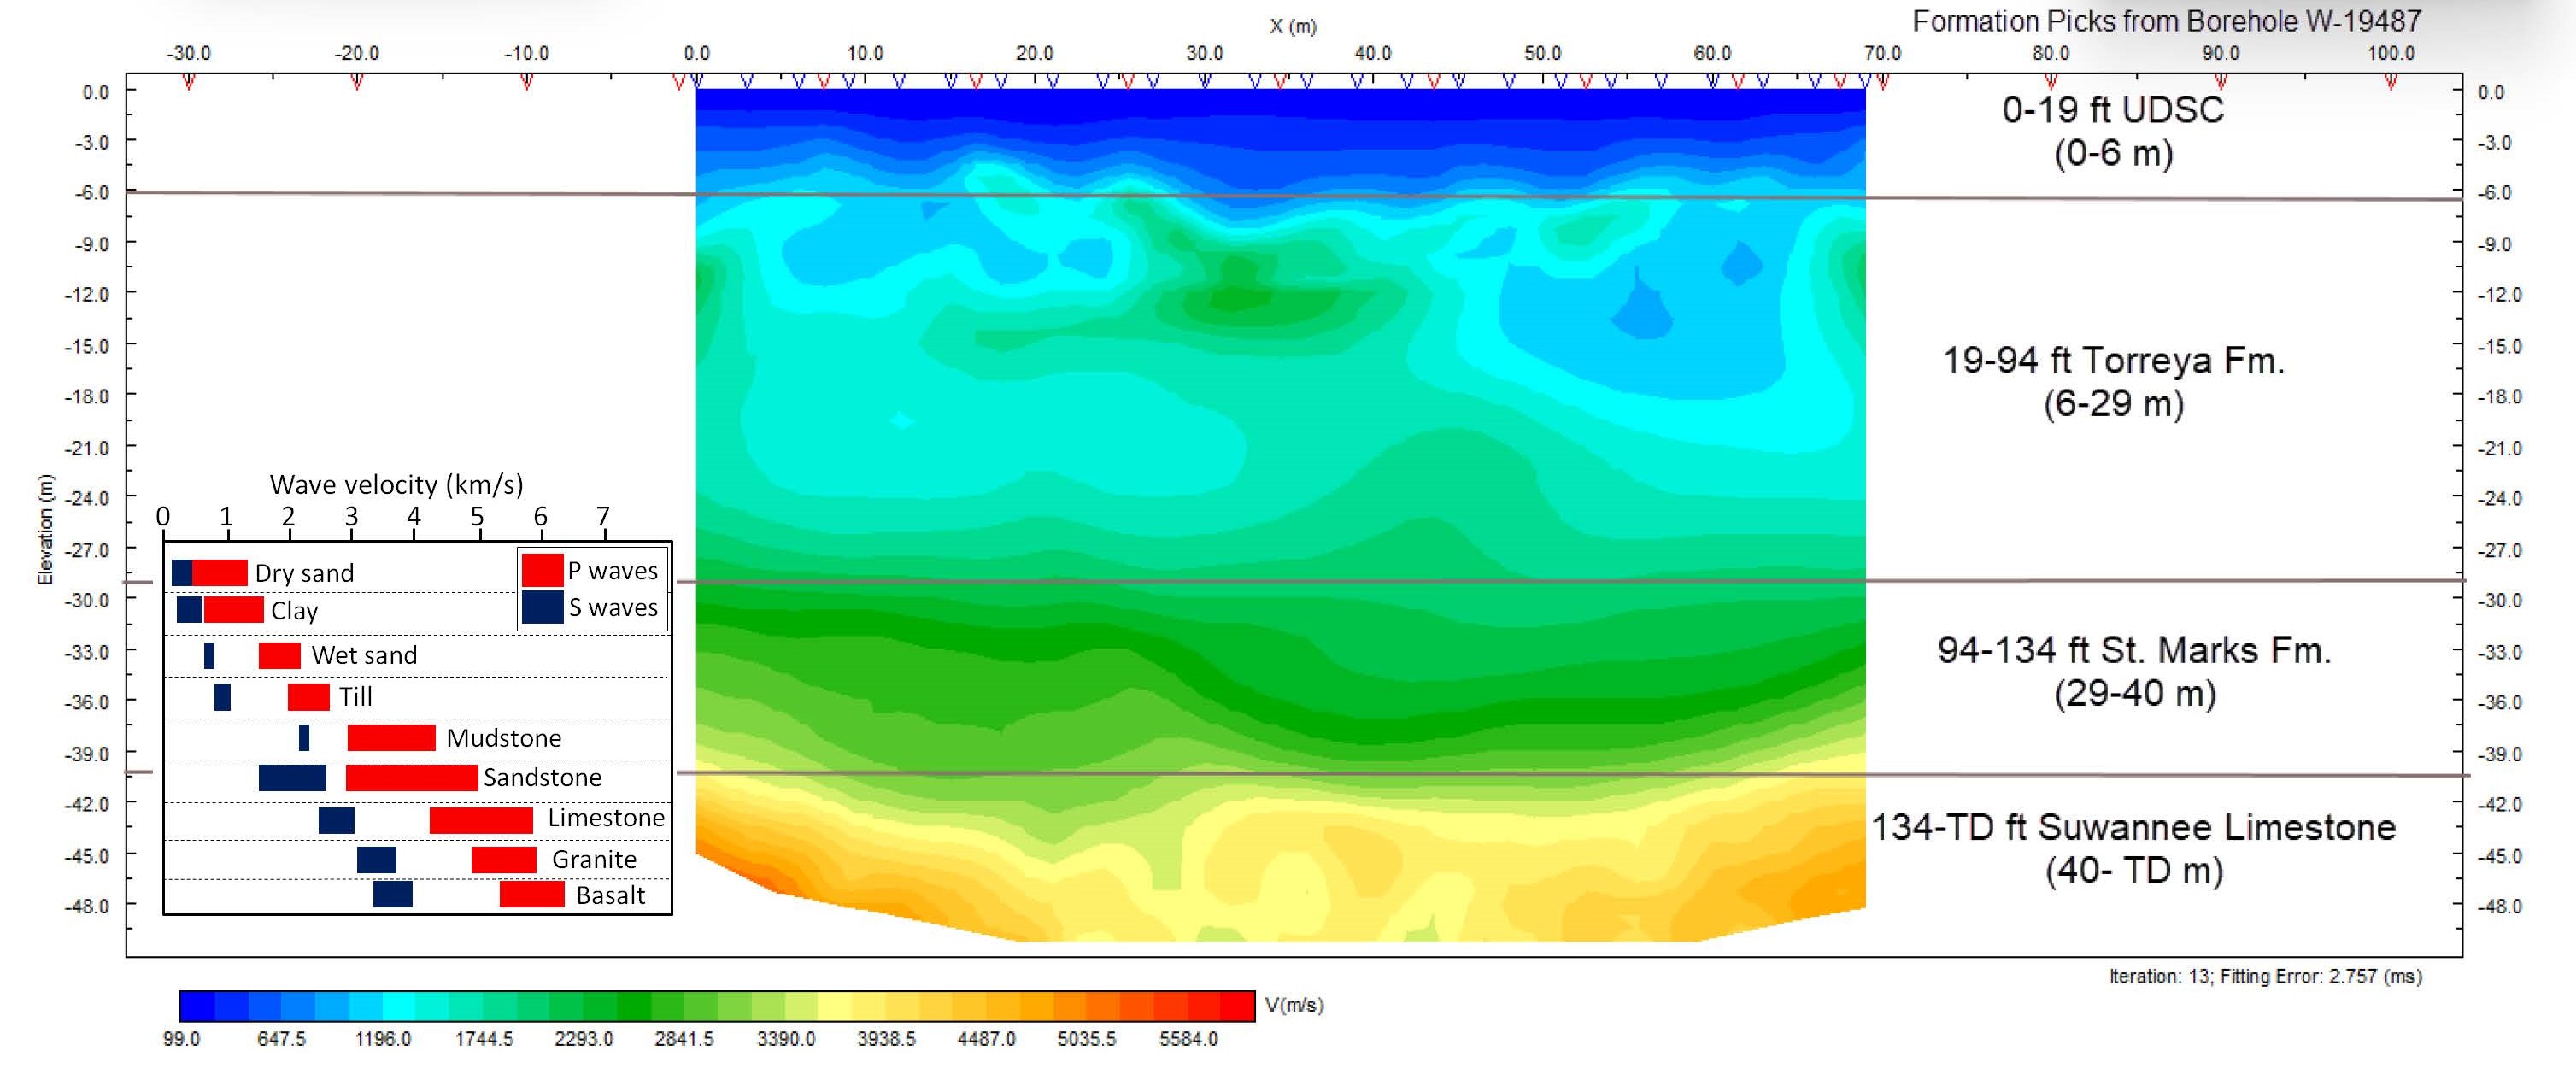
Seismic refraction tomography uses geophones to measure the travel times of first arrivals of compressional waves (P-waves) generated by an source (i.e. sledgehammer) to construct a velocity model of the subsurface. The direction of propagation of the waves in depth follows Snell’s law and at each interface there are phenomena of refraction, reflection and diffraction. Only refracted waves are considered in SRT surveys, as the name implies. SRT allows for a picture of the velocity distribution in the subsurface highlighting the continuous changes in velocity rather than a layered model.
Figure 2. Example of seismic refraction tomography generated velocity profile.
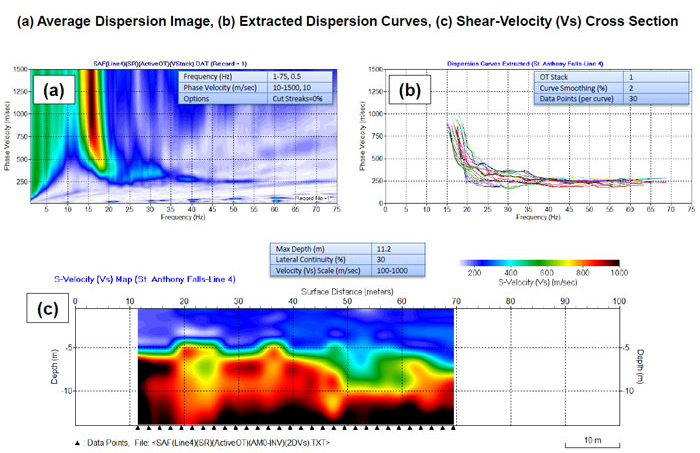
Acoustic, or sound waves, are generated by a percussive source (i.e., sledgehammer) and time arrivals and amplitudes of the waves are recorded by a series of geophones along a transect. A velocity profile is created for the transect based on the velocity values. Depth of investigation for MASW is typically less than 30 meters. MASW is commonly used to identify low-velocity zones associated with karst (sinkholes, conduits, voids, etc.), map the shallow stratigraphy, map top of bedrock, and assess rock strength (rippability).
MASW limitations – Thin layers can be “invisible”. Depth of investigation is limited. Lateral and vertical averaging of acquired data can obscure smaller features.
Figure 3. Example of MASW data (Park, 2019).
The capabilities of each system overlap in many cases; however, the limitations of each system are also varying enough that one method may be more advantageous than others depending on site-specific characteristics. For example, a site that has clay overburden and depth to bedrock or evaluation of subsurface karst is required, GPR will be ineffective whereas ERT and MASW will work. If the same site has abundant underground infrastructure, then MASW may be the best choice. Often a multidisciplinary approach is most appropriate, creating multiple datasets that will increase the confidence of your interpretations. Ultimately, ground-truthing by drilling will provide the most accurate means of corroborating your subsurface interpretations.
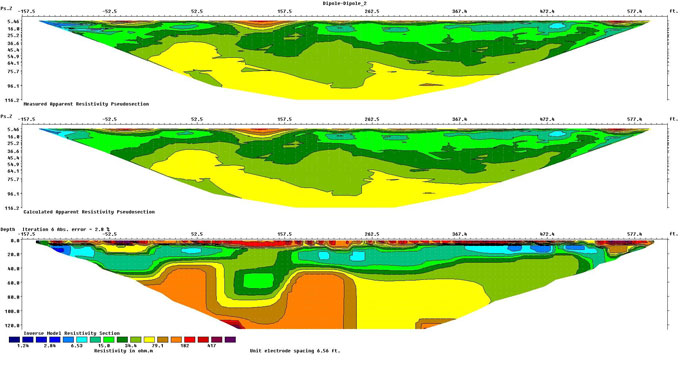
Imaging the subsurface based on the relationship between voltage, current, and resistance (Ohm’s Law). ERT uses the earth as a resistor. Current is injected at multiple points using electrodes and voltages measured from other electrodes and recorded. These data are used to create a depth profile of resistivity values (Figure 2). Depth of penetration and resolution is dependent upon cable spread length, electrode spacing, and array type employed (i.e., Wenner-Schlumberger, dipole-dipole, multiple gradient, etc.). IP measurements are acquired by measuring the time (in milliseconds (msec) of the voltage decay after initial current injection. IP data will show zones that hold charge, such as metals and clays. ERT and IP are commonly used to characterize potential karst and sinkhole conditions, map the top of bedrock, map saltwater interface, determine the presence and thickness of landfill debris, map contaminant plumes, and freshwater mapping.
ERT limitations- infrastructure intersecting transect can cause anomalous low and high resistivity artifacts in data. Highly conductive objects and underground electrical wires can cause these types of interference.
Figure 4. ERT cross-section of lakebed near Porter Sink during the Lake Jackson drawdown event of 2021-2022.

